Month: January 2018

Thoughts on publishing in The Conversation

Last week, as regular readers will know, I had a piece published in The Conversation. Hopefully it will help communicate some of my work to a wider, non-specialist audience, but the process was also interesting.

It’s the first time in many years – since returning to university for my masters – that I’ve tried to write something journalistic. I used to do such articles long ago for the trade press in my old industry, but I never felt very good at it; the writing seemed stilted to me. I wondered whether having trained myself in academic writing would make this more difficult – but to my surprise, the opposite was true.

Small child in a hoodie shouting.

Communication? (Photo: Flickr user mindaugasdanys, licensed CC-BY-2.0)

I did have to consciously avoid some of the usual turns of phrase from journal articles, and try to write more as people speak, but it was much smoother than past experience. I attribute this to three things: part of it is simply that I’ve had more writing experience now. Part will be because this was shorter, so I was concentrating on optimising rather than writing lots. The biggest part was probably the input of the editor.

Unlike the trade magazines that I’ve written for before, which simply use your text verbatim, The Conversation (hereafter TC) assigns a professional editor to each article, as a newspaper might do. However, wheras for a newspaper you’d submit your copy and then be at the editor’s mercy, for TC it’s a two-way process where the researcher gets final approval of everything, including pictures and the headline. We did go back and forth a couple of times where the editor made things a bit too hyperbolic, claiming things that weren’t supported by the study – but she was willing to roll them back when I explained, and she did wonders for improving the readability of the article for the public. It’s a good way of working.

TC provides analytics, and I spent some of last week glued to that page. So far, three days after it appeared, it’s had 1450 readers. This is gratifying, and vastly surpasses both the audience that anything of mine has had before, and the audience that the vast majority of journal articles ever get. For a while I had a response of “eek. So many people. What if it’s controversial, or wrong?”, and I had to remind myself that I do have confidence in my results, and so does a peer reviewer or two.

On Twitter I was gratified to see it retweeted by such accounts as @NERCscience and @BGSScotland, in addition to my own institution. Most of those reads were in the first two days, while it was at the top of the feeds and making its way around social media, and it’s leveled off now; it probably won’t ever get many more. 28% of readers were in the US, which surprised me, 26% in the UK, which didn’t, and 31% in Other, which I wish was broken down more. I hope that a lot of that is Japan, since the article is about the energy situation there.

A dog staring intently at a laptop screen

Readers. (Photo:
Jean Beaufort. Public domain (CC0))

TC also provides analytics that compare your reader numbers to articles published by others from your own institution, and I found myself feeling surprisingly competitive as I watched mine climb from the bottom to… well, quite near the bottom still. The high-flyers there are timely articles that tie in with a news story, or social science based ones that resonate with the zeitgeist and get picked up and republished by The Guardian. That’s fair enough. But having more readers than the articles by two of my former bosses is strangely gratifying!

This wasn’t a major time investment. It probably took two hours to write – which would be less with practice – and maybe an hour after that for editing and correspondence. When considered in the context of the number of hours that go into performing research and getting it into journals, it’s nothing – and it’s a nothing that brings the research to more than a thousand eyes. Good experience, would do again 🙂

Posted by simon in Publications, Reflective

After the tsunami: how tidal energy could help Japan with its nuclear power problem

[wc_box color=”inverse” text_align=”left” margin_top=”” margin_bottom=”” class=””]

This article originally appeared in The Conversation. It is licensed CC-BY-ND. Click here for original.

[/wc_box]

Japan was the third-largest producer of nuclear power in the world in 2011. Then, on March 11 of that year, an earthquake of magnitude 9 was followed by a catastrophic tsunami, resulting in the first nuclear disaster of the 21st century – at the Fukushima Daiichi power station. The country’s nuclear plants were shut down, and within a year Japan had become the world’s second biggest importer of fossil fuels.

Before the tsunami, nuclear power provided 25% of Japan’s electricity, and a strategic plan was in place to expand this to 50%. Japan has few fossil-fuel resources of its own, so most of the resulting shortfall in electricity was made up by burning imported coal, oil and gas – an unsustainable solution from both environmental and economic perspectives.

But on a group of islands to the west, tidal power may offer part of the solution to the country’s energy needs.

A renewable future

By 2030, the Japanese government plans once more for nuclear power to provide around 21% of the nation’s electricity – which is highly controversial – but also stipulates (see page 8) that 22-24% should be delivered by renewable energy sources. At a local scale, two prefectural governments, Fukushima and Nagano, have pledged that all of their electricity will come from renewables by 2050.

Most of the new renewable energy available in 2030 is likely to be solar and wind, along with existing hydropower, but some contribution from the tides is possible. To this end, a zone in the Goto Islands of Nagasaki Prefecture has been designated for tidal energy development, and a cluster of companies plans to install the first turbine in 2019. This project will be of the tidal stream type, where underwater turbines are placed in the free flow without any dam or barrage, similar to the MeyGen project in Scotland.

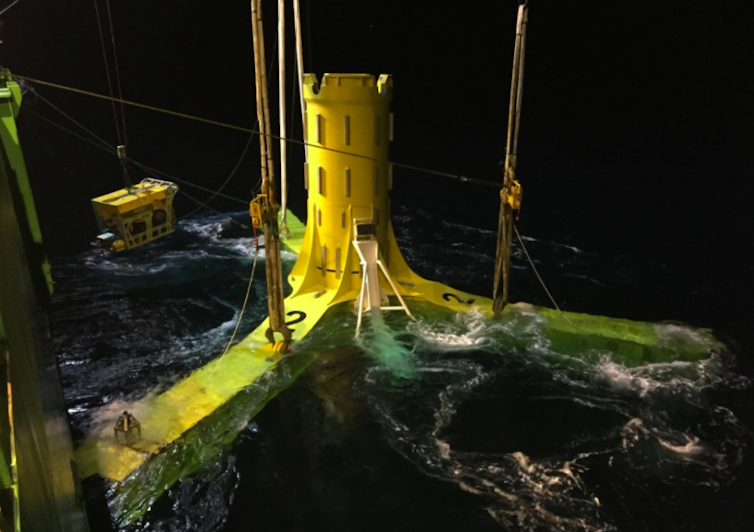
Installing a tidal stream turbine base at the MeyGen project off the coast of Caithness in northeast Scotland.
MeyGen/Atlantis Resources

When tidal turbines are placed in a channel, they remove energy from the flow. This causes it to slow, and represents a partial blockage of that channel. In turn, that means that the behaviour of the tides in an area after turbines are installed can be different to how it was before. Understanding and predicting this change is important for estimating both how much energy is available and the impacts of removing it; if there are too many turbines, the flow could slow too much and much less power would be generated.

Going with the flow

My recent work, in collaboration with researchers in Scotland and Japan, involved using a computer simulation of tidal flow around the Goto Islands to investigate the effects of installing large numbers of turbines.

We estimated that between 24 and 79 MW of power could be generated from the designated area. The reason for this range is because the number of turbines that are used will ultimately depend on economic considerations. The first few will offer the most benefit, while later ones will suffer from diminishing returns. Tens of megawatts represents a very small contribution to Japan’s overall electricity needs, but a very large chunk of the local demand in these islands.

A number of parallel channels run through the Goto archipelago, of which two are within the tidal energy zone. In situations like this, it is common to find that adding turbines to one channel simply causes the water to flow by a different route. That means that to harvest energy efficiently we need to collect it from all the channels at once – an expensive proposition for a new technology.

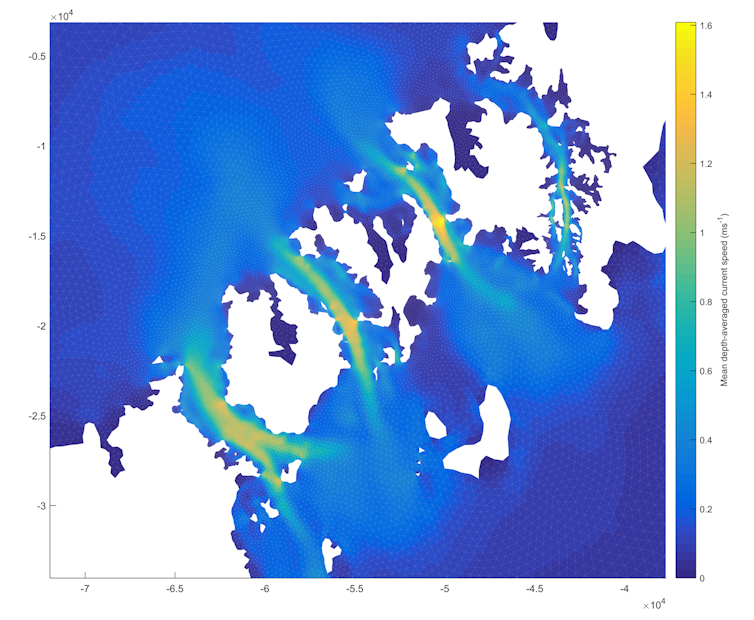
In the Goto Islands, all the channels run parallel but separate to each other, never merging or meeting, so they can each be exploited without affecting the others.
Elsevier, Author provided

However, our modelling shows (see sections 4 and 7.2) that the parallel channels in Goto do not behave this way; instead, they are independent of each other. The reason for this unusual behaviour lies in the geometry of the islands.

Partially blocking a channel causes water levels to rise a little behind the blockage. The interactions that we see elsewhere in the world are a result of this extra water “spilling” into other channels. In Goto, because all of the channels run separately from one end to the other without meeting or merging, and because their mouths are spaced well apart, there is no way for this “overspill” to occur. Consequently, any or all of the channels can be exploited without affecting the others, which should make the area more attractive for commercial development.

If the relatively small-scale development in Goto is a success, it could act as a proving ground and a springboard, leading to the use of tidal energy in other locations all over Japan. And for a country ambivalent about its return to dependence on nuclear power, additional contributions from renewable energy will be welcome.

The Conversation

Posted by simon in Working in Japan, Written elsewhere

“My favourite tool”

[wc_box color=”inverse” text_align=”left” margin_top=”” margin_bottom=”” class=””]

Software Carpentry are running a series of short blog posts where they ask their supporters what their favourite tools are. Most have been software, although a few people have gone for things like “asking for help”. QGIS probably isn’t my favourite tool, but my first few choices had already been mentioned by others…

This post originally appeared at https://software-carpentry.org/blog/2018/01/waldman-fave.html

[/wc_box]

QGIS (formerly Quantum GIS) is an open source Geographic Information System.

QGIS is capable of advanced analysis and cartography, but I don’t use it for that.

In my research in hydrodynamic modelling, I deal with a lot of spatial data – coastlines, bathymetry, and the like – and this will eventually be processed and plotted using R, MATLAB or Python.

But if I’ve received a file and simply want to take a quick look at it, or if I want to quickly compare two files that use different coordinate systems and see if things line up, most of the time I can throw the file at QGIS and it will show it to me with a few clicks. This approach lacks the reproducibility of a coded solution, but it’s an awful lot quicker for a throwaway visualisation.

Posted by simon in Written elsewhere